
Getting Started with Matlab for EEG Experiments
Chuck Anderson
startup.m with the contents
format compact
more off
addpath /s/parsons/e/fac/anderson/matlab/chuck/nn
addpath /s/parsons/e/fac/anderson/matlab/chuck/stats
addpath /s/parsons/e/fac/anderson/matlab/chuck/eeg
When matlab starts, it evaluates the lines in this file, as if you had typed them in interactively. This adds some of my matlab directories to your matlab path.
You must also add the matlab/bin directory to your shell's search
path. For csh, you can add these lines to your .cshrc
file:
# for Matlab
setenv MATLAB /s/parsons/l/sys/matlab64
alias matlabwho $MATLAB/etc/lmstat -a
setenv PATH ${PATH}:${MATLAB}/bin
setenv LD_LIBRARY_PATH  ${LD_LIBRARY_PATH}:${MATLAB}/extern/lib/sol2:${MATLAB}/extern/lib/glnx86
setenv MANPATH  ${MANPATH}:${MATLAB}/man
setenv JAVA_HOME /usr/local/java
After sourcing your .cshrc file or re-logging in, you
can start matlab:
> matlab -nojvm

                              < M A T L A B >
                  Copyright 1984-2001 The MathWorks, Inc.
                       Version 6.1.0.450 Release 12.1
                                May 18 2001


  To get started, type one of these: helpwin, helpdesk, or demo.
  For product information, visit www.mathworks.com.

Diary is being appended to DiaryMatlab
>>
I like running matlab with the -nojvm option, so I don't
waste time starting up the Java virtual machine and I also don't get
the Java-based GUI for interacting with matlab. I prefer the old
text-based form.
The final thing you see is >>, the matlab prompt. Type
quit and return to leave matlab.
load_eegdata:
>> load_eegdata
eegdata_subjects =
    's1'    's3'    's4'    's5'    's6'
eegdata_tasknames =
    'rest'    'letter'    'math'    'rotation'    'counting'
eegdata_tasks =
    'aeo'    'lceo'    'maeo'    'reo'    'veo'
eegdata_trials =
     1     2     3     4     5     6     7     8     9    10
eegdata_rows =
    'c3'    'c4'    'p3'    'p4'    'o1'    'o2'    'eog'
eegdata_example =
eegdata{2,3,4}(1:6,:) returns a 6x2500 matrix of the EEG channels
           for subject 2 (s3), task 3 (math), and trial 4
You can see where this function is located by
>> which load_eegdata
/s/parsons/e/fac/anderson/matlab/chuck/eeg/load_eegdata.m
so you see this is a function I have written. To see the matlab code in this file, just do
>> type load_eegdata

if ~exist('eegdata') | isempty(eegdata)
  load /s/parsons/e/fac/anderson/matlab/chuck/eeg/eegdata
  %eegdata
  eegdata_subjects
  eegdata_tasknames
  eegdata_tasks
  eegdata_trials
  eegdata_rows
  eegdata_example
else
  fprintf(1,'\nUsing previously loaded eegdata.\n\n');
end
Pretty simple.
Curious about what variables this function has loaded into your matlab
workspace? Use the whos command
>> whos
  Name                    Size           Bytes  Class

  eegdata                 5x5x10      35023000  cell array
  eegdata_example         1x133            266  char array
  eegdata_rows            1x7              674  cell array
  eegdata_subjects        1x5              480  cell array
  eegdata_tasknames       1x5              520  cell array
  eegdata_tasks           1x5              494  cell array
  eegdata_trials          1x10              80  double array

Grand total is 4375487 elements using 35025514 bytes
If you are also curious about the
whos command or any
other command or function, just type help whos. You can
see that most of the bytes, about 35 MB worth, is in the cell array
eegdata. This is the data. eegdata_example
is a string that shows you how to access the data stored in this cell
array:
>> eegdata_example
eegdata_example =
eegdata{2,3,4}(1:6,:) returns a 6x2500 matrix of the EEG channels
           for subject 2 (s3), task 3 (math), and trial 4
Let's look at some of this data. The data recorded from Subject 2,
for Task 3, and Trial 4, is in eegdata{2,3,4}. If you
type that and hit return, you will see a lot of numbers scroll across
the screen. Instead of text, let's plot it. First, check its size
and shape.
>> size(eegdata{2,3,4})
ans =
           7        2500
Seven rows by 2500 columns. This for six EEG channels, and one EOG
channel to detect eye movements, and the number of columns is for the
10 seconds of data samples 250 times per second. We can draw the
seven time series on one graph by doing
>> plot(eegdata{2,3,4}')
The ' is to transpose this matrix. The plot command
draws one curve for each column, so we must transpose the matrix. Here
is the result:
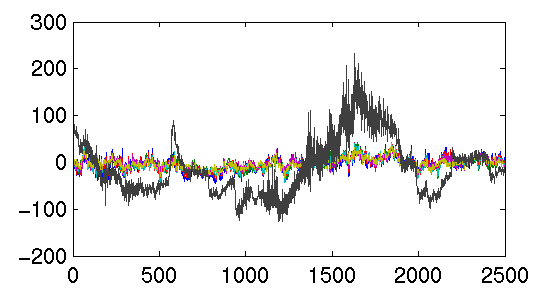
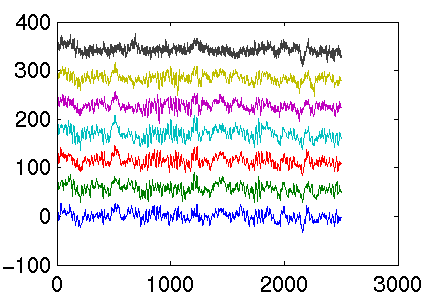
It's hard to see the curves when they are superimposed. Let's plot
them spread out vertically. We can do this by
>> plotEEG(eegdata{2,3,4}')
using a function I have written. Again, if you are curious how this
function is coded, just take a look:
>> type plotEEG

function plotEEG(data)

m = max(max(abs(data)));
numChannels = size(data,2);

plot(data + (ones(size(data,1),1)*(1:numChannels) - 1) * m * 1.5);
The plot looks like

Let's try a different trial:
>> plotEEG(eegdata{2,3,1}')