Lab 4: Getting Started with Intel Tools
Goal:
This lab will let you try some of the frequently used Intel tools on the CS department machines.
References:
Source:
Background:
The Intel Math Kernel Library (MKL) helps you achieve maximum performance with a math computing library of highly optimized, extensively parallelized routines for CPU and GPU. In this lab, we will focus on the matrix multiplication / dgemm kernel.
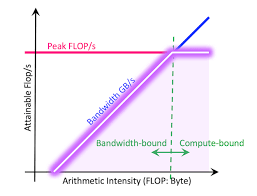
The Roofline Toolkit provides a visual representation of application performance in relation to hardware limitations, including memory bandwidth and computational peaks. A Roofline chart produces a plot of GFLOPs vs the Arithmetic Intensity as shown below:

Tasks:
Task A: Testing MKL kernelsSteps:
- Load the right modeule using the command: load compilers/icc
- Download the mkl-samples and the simple matrix multiply code from the
sources section of this document
- Extract the downloaded files and enter the directory.
- Run the following two commands to compile files. make; make
run_dgemm_example
- Now, we can use the following command to do some
testing. ./release/matrix_multiplication
Submission: Compare the execution time for the simple matrix
multiply code and the dgemm code (MKL) for similar sized inputs. Report the
approximate execution time while avoiding any major run-to-run variations.
Task B: Testing the Roofline ToolkitSteps:
- Load the right modeule using the command: load
dev/intel-advisor
- Use the following command to launch the
toolkit: advixe-gui. Make sure to have Xdisplay set up while using
an SSH session for this task.
- Create a new project and use the compiled binaries created in Task A.
- Running tests with higher overhead would result in the experiments
repeated a few times to report consistent results. The Roofline chart would
be displayed after the tests are completed.
- The Red circles in the chart represent the parts of code where the most
amount of time is spent. Other details can be seen on hovering over the
circles.
- Look at the sources section and try to identify the part of code which
consumes the most time. (The -g flag must be enabled during compilation to
see this)
Click here to see screenshots to run the Roofline
Toolkit: Roofline MKL Example
Submission: Based on the image in the Background section, find if
the tested binaries are bandwidth bound or compute bound. (Hint: Try
experimenting with sizes small enough to fit in cache and large sizes which go
in the DRAM)
Task C: Profile Your Own Code Using the Roofline ToolkitSteps:
- Consider the provided (sequential) code for the 2D stencil, for PA1.
- Modify the compilation of this project so that it uses icc
instead of gcc.
- Use advixe-gui to profile the original and optimized versions
of the code from this project.
- Revisit Lab2, and compare the plots for all the different permutations
and do the same.
- Optional: Study what happens with a (any) tiled version
of syr2k and report what happens.
Submission:
- What were the bottlenecks of this project, i.e., did you identify which
line was limiting performance? How can you be sure?
- How did your optimization(s) change the bottleneck?
- What is the best performance achieved, as a percentage of TMP?
What to Turn In
Work with your group to write a report containing your results from the
three Submission sections from the tasks above. If you had any "aha
moments," pleasae describe what the particular insights were. Submit it to
Canvas.
After you are done, you may find it useful to see one af the YouTube videos
like this,
this, or
this, about how to "read" laogarithmic plot.
Created by Vidit Save 1/30/2023
