Getting Started with EEG Data
In 2011-2012, the brain-computer interface (BCI) research group at Colorado State University recorded EEG signals from subjects in our lab and in their homes, using three different EEG systems. One goal of this work is to determine if inexpensive EEG systems (about $7,000) are as effective as more expensive ones (about $40,000) for conducting BCI experiments in the home.
On this page, we summarize the steps you can follow to download some of the data, load it into an ipython environment, and visualize it. We also show examples of looking at P300 ERP’s.
Downloading EEG Data
EEG data from multiple subjects can be downloaded from our Public BCI Data site. Let’s select the data files for the first subject in each device column, for subjects recorded in our lab.
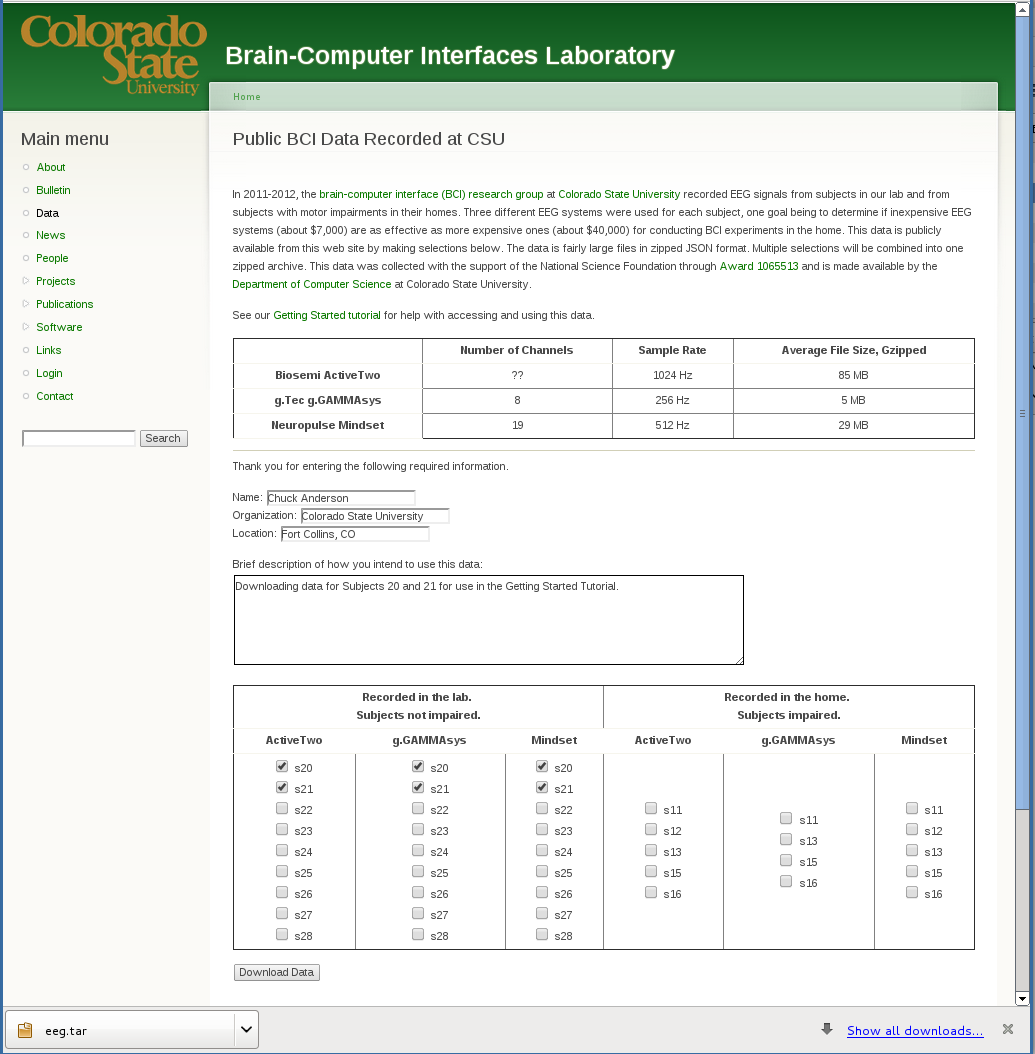
The zip file should contain six zipped data files.
> cd ~/Download

> unzip eeg.zip
Archive:  eeg.zip
 extracting: s20-activetwo-gifford-unimpaired.json.zip
 extracting: s21-activetwo-gifford-unimpaired.json.zip
 extracting: s20-gammasys-gifford-unimpaired.json.zip
 extracting: s21-gammasys-gifford-unimpaired.json.zip
 extracting: s20-mindset-gifford-unimpaired.json.zip
 extracting: s21-mindset-gifford-unimpaired.json.zip

> rm eeg.zip

> ls -l --block-size=M *json*
-rw-r--r-- 1 ... 84M Mar 12 10:50 s20-activetwo-gifford-unimpaired.json.zip
-rw-r--r-- 1 ...  5M Mar 12 10:50 s20-gammasys-gifford-unimpaired.json.zip
-rw-r--r-- 1 ... 29M Mar 12 10:50 s20-mindset-gifford-unimpaired.json.zip
-rw-r--r-- 1 ... 80M Mar 12 10:51 s21-activetwo-gifford-unimpaired.json.zip
-rw-r--r-- 1 ...  5M Mar 12 10:51 s21-gammasys-gifford-unimpaired.json.zip
-rw-r--r-- 1 ... 28M Mar 12 10:52 s21-mindset-gifford-unimpaired.json.zip

> unzip s20-gammasys-gifford-unimpaired.json.zip
Archive:  s20-gammasys-gifford-unimpaired.json.zip
  inflating: s20-gammasys-gifford-unimpaired.json

> unzip s20-mindset-gifford-unimpaired.json.zip
Archive:  s20-mindset-gifford-unimpaired.json.zip
  inflating: s20-mindset-gifford-unimpaired.json

> unzip s20-activetwo-gifford-unimpaired.json.zip
Archive:  s20-activetwo-gifford-unimpaired.json.zip
  inflating: s20-activetwo-gifford-unimpaired.json

> rm s20*zip
Loading g.GAMMAsys EEG Data into IPython
Let’s start with the smallest file, the one recorded with the g.tec g.GAMMAsys system. Unzip it.
The unzipped data can loaded into an ipython environment.
In [1]: import json

In [2]: data = json.load(open('s20-gammasys-gifford-unimpaired.json','r'))
The variable data is a list of dictionaries, each with the same keys.
In [1]: len(data)
Out[1]: 8

In [2]: data[0].keys()
Out[2]:
[u'protocol',
 u'sample rate',
 u'notes',
 u'channels',
 u'date',
 u'location',
 u'device',
 u'eeg',
 u'impairment',
 u'subject']
Here is a handy function to show keys and their values in each data element.
import numpy as np

def summarize(datalist):
    for i,element in enumerate(datalist):
        keys = element.keys()
        print '\nData set', i
        keys.remove('eeg')
        for key in keys:
            print '  {}: {}'.format(key,element[key])
        eegtrials = element['eeg']
        shape = np.array(eegtrials['trial 1']).shape
        print ('  eeg: {:d} trials, each a matrix with {:d} rows' +
              ' and approximately {:d} columns').format( \
            len(eegtrials), shape[0], shape[1])
In [1]: summarize(data)

Data set 0
  protocol: 3minutes
  sample rate: 256
  notes:
  channels: [u'F3', u'F4', u'C3', u'C4', u'P3', u'P4', u'O1', u'O2']
  date: [2012, 3, 8]
  location: gifford
  device: GAMMAsys
  impairment: none
  subject: 20
  eeg: 1 trials, each a matrix with 9 rows and approximately 46330 columns

Data set 1
  protocol: grid-p
  sample rate: 256
  notes:
  channels: [u'F3', u'F4', u'C3', u'C4', u'P3', u'P4', u'O1', u'O2']
  date: [2012, 3, 8]
  location: gifford
  device: GAMMAsys
  impairment: none
  subject: 20
  eeg: 1 trials, each a matrix with 9 rows and approximately 17692 columns

Data set 2
  protocol: grid-b
  sample rate: 256
  notes:
  channels: [u'F3', u'F4', u'C3', u'C4', u'P3', u'P4', u'O1', u'O2']
  date: [2012, 3, 8]
  location: gifford
  device: GAMMAsys
  impairment: none
  subject: 20
  eeg: 1 trials, each a matrix with 9 rows and approximately 17695 columns

Data set 3
  protocol: grid-d
  sample rate: 256
  notes:
  channels: [u'F3', u'F4', u'C3', u'C4', u'P3', u'P4', u'O1', u'O2']
  date: [2012, 3, 8]
  location: gifford
  device: GAMMAsys
  impairment: none
  subject: 20
  eeg: 1 trials, each a matrix with 9 rows and approximately 17696 columns

Data set 4
  protocol: letter-p
  sample rate: 256
  notes:
  channels: [u'F3', u'F4', u'C3', u'C4', u'P3', u'P4', u'O1', u'O2']
  date: [2012, 3, 8]
  location: gifford
  device: GAMMAsys
  impairment: none
  subject: 20
  eeg: 1 trials, each a matrix with 9 rows and approximately 17692 columns

Data set 5
  protocol: letter-d
  sample rate: 256
  notes:
  channels: [u'F3', u'F4', u'C3', u'C4', u'P3', u'P4', u'O1', u'O2']
  date: [2012, 3, 8]
  location: gifford
  device: GAMMAsys
  impairment: none
  subject: 20
  eeg: 1 trials, each a matrix with 9 rows and approximately 17691 columns

Data set 6
  protocol: letter-b
  sample rate: 256
  notes:
  channels: [u'F3', u'F4', u'C3', u'C4', u'P3', u'P4', u'O1', u'O2']
  date: [2012, 3, 8]
  location: gifford
  device: GAMMAsys
  impairment: none
  subject: 20
  eeg: 1 trials, each a matrix with 9 rows and approximately 17692 columns

Data set 7
  protocol: mentaltasks
  sample rate: 256
  notes:
  channels: [u'F3', u'F4', u'C3', u'C4', u'P3', u'P4', u'O1', u'O2']
  date: [2012, 3, 8]
  location: gifford
  device: GAMMAsys
  impairment: none
  subject: 20
  eeg: 6 trials, each a matrix with 9 rows and approximately 15623 columns
Plotting some EEG
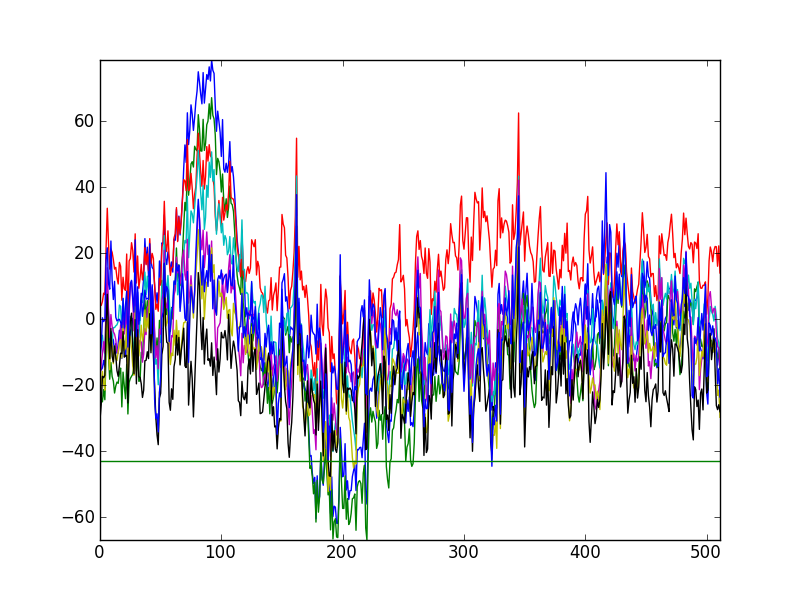
The first element of the data list has key-value pair protocol: 3minutes, meaning that this element contains 3 minutes of EEG recorded while the subject was asked to relax and look at the computer screen. Let’s take a look at 2 seconds of this data.
The EEG consists of one matrix with 9 rows and 46,342 columns. The 9 rows correspond to the channels channels: ['F3', 'F4', 'C3', 'C4', 'P3', 'P4', 'O1', 'O2'] plus one more channel that is used to mark stimuli onset and offset, which is not used for the 3 minute protocol. The number of samples (in columns) in one second depends on the sample rate, which for this device, device: GAMMAsys, is 256 samples per second, sample rate: 256. Let’s plot data from all 9 channels for columns 1,000 to 1,512.
In [1]: import numpy as np

In [2]: import matplotlib.pyplot as plt

In [3]: first = data[0]

In [4]: eeg = np.array(first['eeg']['trial 1'])

In [5]: eeg.shape
Out[5]: (9, 46330)

# Using ending semicolon to suppress output of plotting functions.
In [6]: plt.figure(1);

In [7]: plt.plot(eeg[:,4000:4512].T);

In [8]: plt.axis('tight');
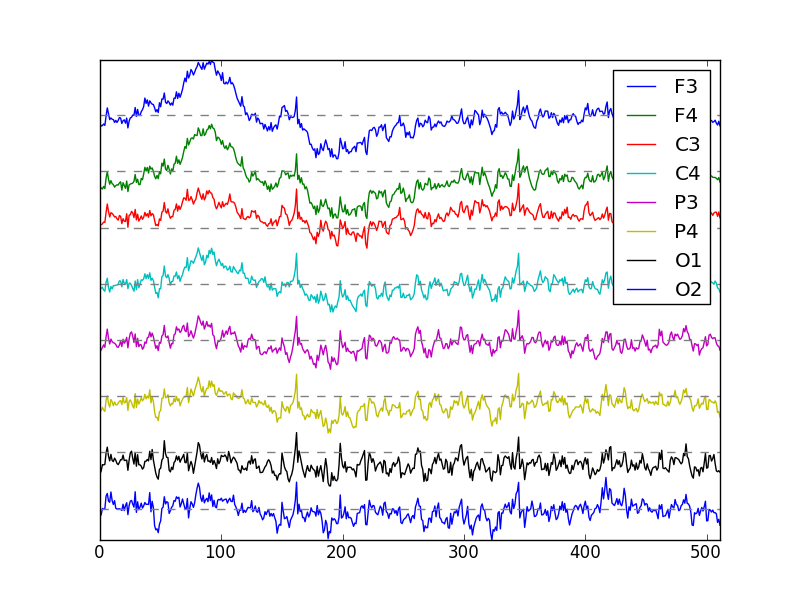
Kind of hard to see each channel. Let’s spread them out and not plot the constant, unused, 9th channel. Also, we can add a legend with the channel names. If we reverse the vertical order of the channel plots, they will correspond with the vertical order of the channel names.
In [1]: plt.figure(2);

In [2]: plt.plot(eeg[:8,4000:4512].T + 80*np.arange(7,-1,-1));

In [3]: plt.plot(np.zeros((512,8)) + 80*np.arange(7,-1,-1),'--',color='gray');

In [4]: plt.yticks([]);

In [5]: plt.legend(first['channels']);

In [6]: plt.axis('tight');
Again, for EEG from ActiveTwo and Mindset Systems
Now let’s summarize the data from the other two systems. First, rename data to dataGammasys.
In [1]: dataGammasys = data

In [2]: dataActivetwo = json.load(open('s20-activetwo-gifford-unimpaired.json','r'))

In [3]: dataMindset = json.load(open('s20-mindset-gifford-unimpaired.json','r'))

In [4]: summarize(dataMindset[0:2])

Data set 0
  target indicator: []
  protocol: 3minutes
  sample rate: 512
  notes:
  channels: [u'FP1', u'FP2', u'F3', u'F4', u'C3', u'C4', u'P3', u'P4', u'O1', u'O2', u'F7', u'F8', u'T3', u'T4', u'T5', u'T6', u'CZ', u'FZ', u'PZ']
  device: mindset
  location: gifford
  date: [2012, 4, 7]
  impairment: none
  subject: 20
  eeg: 1 trials, each a matrix with 24 rows and approximately 92160 columns

Data set 1
  target indicator: [0, 0, 1, 0, 0, 1, 0, 1, 0, 0, 0, 0, 0, 0, 0, 0, 0, 0, 0, 0, 0, 0, 1, 0, 0, 0, 0, 0, 0, 0, 1, 0, 0, 0, 1, 0, 0, 0, 1, 1, 0, 0, 1, 1, 0, 0, 0, 0, 0, 1, 1, 0, 0, 1, 0, 0, 0, 0, 1, 0, 0, 1, 0, 1, 0, 0, 0, 0, 1, 0, 0, 1, 0, 0, 0, 1, 0, 0, 1, 0]
  protocol: grid-p
  sample rate: 512
  notes:
  channels: [u'FP1', u'FP2', u'F3', u'F4', u'C3', u'C4', u'P3', u'P4', u'O1', u'O2', u'F7', u'F8', u'T3', u'T4', u'T5', u'T6', u'CZ', u'FZ', u'PZ']
  device: mindset
  location: gifford
  date: [2012, 4, 7]
  impairment: none
  subject: 20
  eeg: 1 trials, each a matrix with 24 rows and approximately 36352 columns
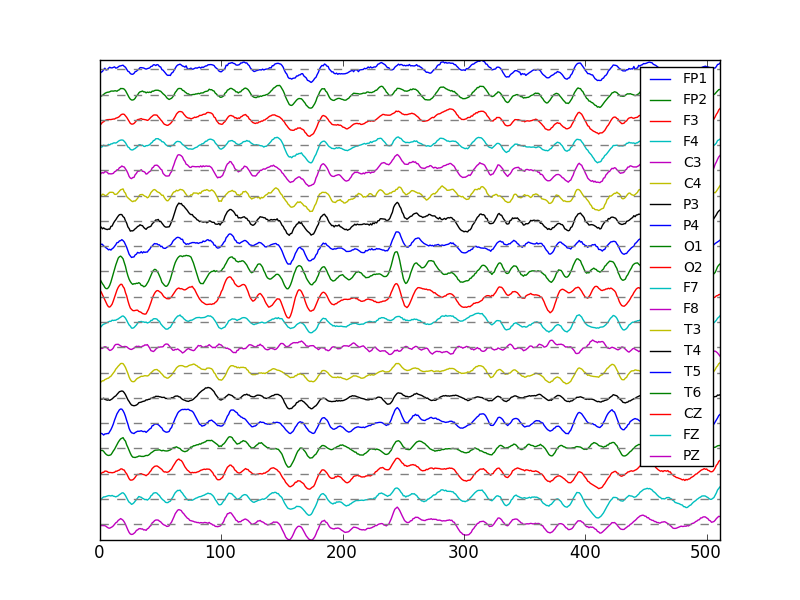
This shows that the Mindset has 19 channels of EEG, but the EEG matrix has 24 rows. The first 19 rows are the EEG channels. Let’s plot them.
In [1]: eegMindset = np.array(dataMindset[0]['eeg']['trial 1'])

In [2]: plt.figure();

In [3]: plt.plot(eegMindset[:19,4000:4512].T + 30*np.arange(18,-1,-1));

In [4]: plt.plot(np.zeros((512,19)) + 30*np.arange(18,-1,-1),'--',color='gray');

In [5]: plt.yticks([]);

In [6]: plt.legend(dataMindset[0]['channels'], prop={'size':10});

In [7]: plt.axis('tight');
Now for the data from the ActiveTwo system. First, let’s see which element in the list is for the 3minutes protocol.
In [1]: summarize(dataActivetwo[0:2])

Data set 0
  protocol: mentaltasks
  sample rate: 1024.0
  notes:
  channels: [u'Fp1', u'AF3', u'F7', u'F3', u'FC1', u'FC5', u'T7', u'C3', u'CP1', u'CP5', u'P7', u'P3', u'Pz', u'PO3', u'O1', u'Oz', u'O2', u'PO4', u'P4', u'P8', u'CP6', u'CP2', u'C4', u'T8', u'FC6', u'FC2', u'F4', u'F8', u'AF4', u'Fp2', u'Fz', u'Cz', u'EXG1', u'EXG2', u'EXG3', u'EXG4', u'EXG5', u'EXG6', u'EXG7', u'EXG8', u'Status']
  date: [2012, 2, 23]
  location: gifford
  device: activetwo
  impairment: none
  subject: 20
  eeg: 1 trials, each a matrix with 41 rows and approximately 334848 columns

Data set 1
  protocol: 3minutes
  sample rate: 1024.0
  notes:
  channels: [u'Fp1', u'AF3', u'F7', u'F3', u'FC1', u'FC5', u'T7', u'C3', u'CP1', u'CP5', u'P7', u'P3', u'Pz', u'PO3', u'O1', u'Oz', u'O2', u'PO4', u'P4', u'P8', u'CP6', u'CP2', u'C4', u'T8', u'FC6', u'FC2', u'F4', u'F8', u'AF4', u'Fp2', u'Fz', u'Cz', u'EXG1', u'EXG2', u'EXG3', u'EXG4', u'EXG5', u'EXG6', u'EXG7', u'EXG8', u'Status']
  date: [2012, 2, 23]
  location: gifford
  device: activetwo
  impairment: none
  subject: 20
  eeg: 1 trials, each a matrix with 41 rows and approximately 185344 columns

In [2]: eegActivetwo = np.array(dataActivetwo[1]['eeg']['trial 1'])

In [3]: eegActivetwo.shape
Out[3]: (41, 185344)
This data matrix contains 41 rows. The list of channels is the 41 names
In [1]: dataActivetwo[1]['channels']
Out[1]:
[u'Fp1',
 u'AF3',
 u'F7',
 u'F3',
 u'FC1',
 u'FC5',
 u'T7',
 u'C3',
 u'CP1',
 u'CP5',
 u'P7',
 u'P3',
 u'Pz',
 u'PO3',
 u'O1',
 u'Oz',
 u'O2',
 u'PO4',
 u'P4',
 u'P8',
 u'CP6',
 u'CP2',
 u'C4',
 u'T8',
 u'FC6',
 u'FC2',
 u'F4',
 u'F8',
 u'AF4',
 u'Fp2',
 u'Fz',
 u'Cz',
 u'EXG1',
 u'EXG2',
 u'EXG3',
 u'EXG4',
 u'EXG5',
 u'EXG6',
 u'EXG7',
 u'EXG8',
 u'Status']
The channels named EXG1 through EXG6 contain non-EEG data as follows:
| Channel | Index | Electrode |
|---|---|---|
| EXG1 | 32 | EOG vertical left |
| EXG2 | 33 | EOG vertical right |
| EXG3 | 34 | EOG horizontal left |
| EXG4 | 35 | EOG horizontal right |
| EXG5 | 36 | earlobe left |
| EXG6 | 37 | earlobe right |
Typically, the EEG channels (indices 0 through 31) are referenced to the earlobes, after removing the linear trend. That’s easy.
In [1]: import scipy.signal as sig

In [2]: eegActivetwo = sig.detrend(eegActivetwo,1)

In [3]: ref = np.mean(eegActivetwo[36:38,:],axis=0).reshape((1,-1))

In [4]: eeg = eegActivetwo[:32,:] - ref
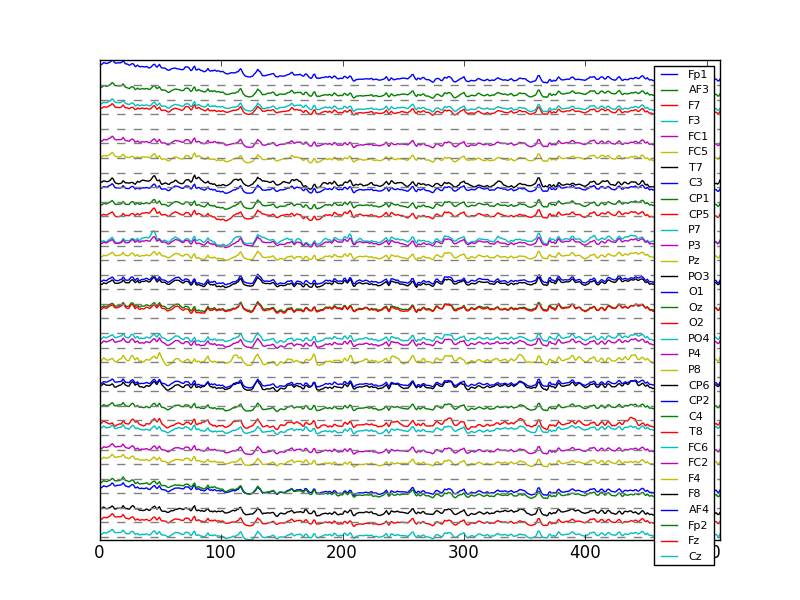
Now we can plot all 32 EEG channels.
In [1]: plt.figure();

In [2]: plt.plot(eeg[:,4000:4512].T + 150*np.arange(31,-1,-1));

In [3]: plt.plot(np.zeros((512,32)) + 150*np.arange(31,-1,-1),'--',color='gray');

In [4]: plt.yticks([]);

In [5]: plt.legend(dataActivetwo[0]['channels'][:32], prop={'size':8});

In [6]: plt.axis('tight');