You are here
CEBL3
Overview
The Colorado Electroencephalography and Brain-Computer Interfaces Laboratory (CEBL, pronounced sěbl) version 3 is the latest version of our flagship BCI software. CEBL3 is written primarily in Python and is intended to be useful for offline analysis of EEG signals as well as performing interactive, real-time BCI experiments. CEBL3 has a modular architecture making it straightforward to add new real-time BCI components (called pages) as well as signal processing routines and machine learning algorithms. See our recent poster for more details!
Preview
CEBL3 is currently under heavy development and is likely to change significantly in the coming months. We do, however, have much of the core functionality working:
- A flexible EEG container and a system for marking and segmenting the data.
- Various filtering and smoothing algorithms, including IIR, FIR, moving average and Savitzky Golay.
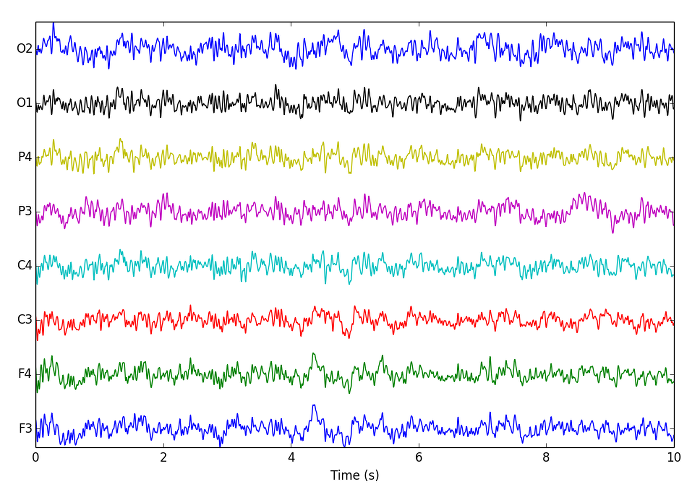
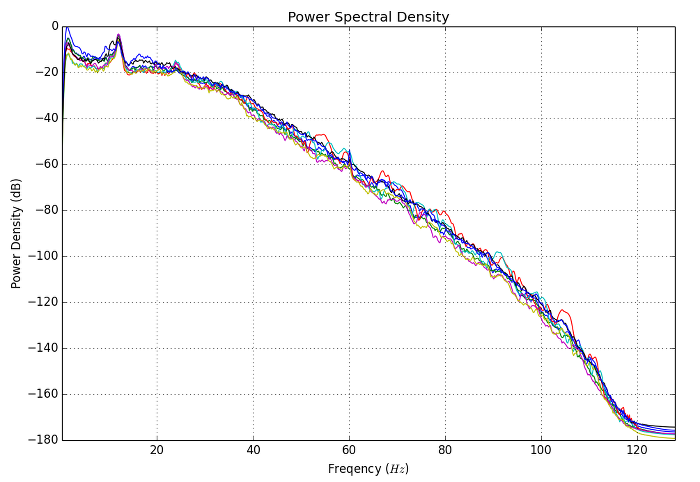
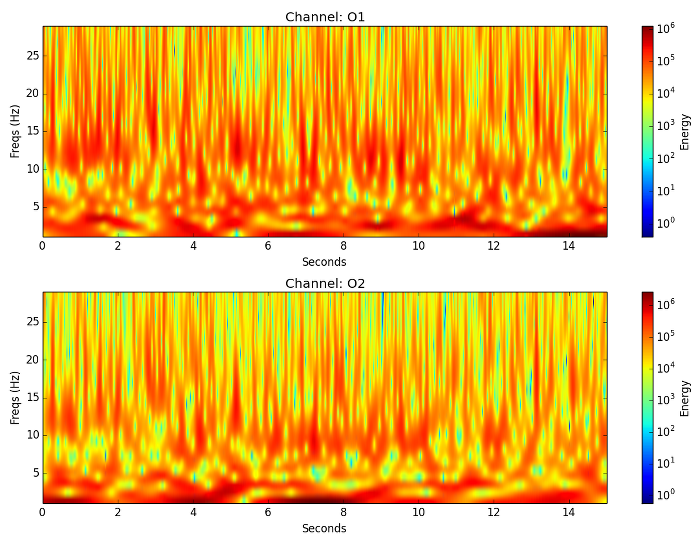
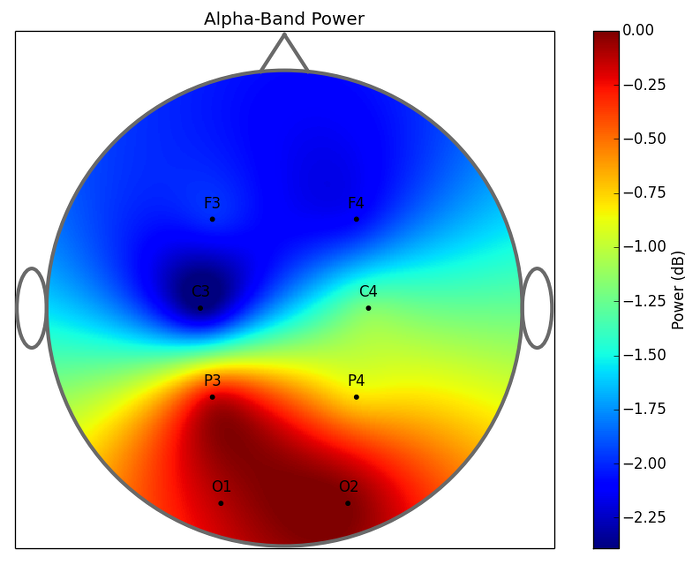
- Routines for analizing and visualizing EEG in both the time and frequency domains, including traces, power-spectral densities, continuous wavelet transforms and algorithms for interpolating values between EEG sensors in 2d,3d and spherical representations.
- Various machine learning algorithms, including Linear and Quadratic Disciminant Analysis, Logistic Regression and Artificial Neural Networks.
- Support for collecting data from the g.tec g.mobilab+ in real-time.
- Routines for collecting and processing streaming real-time EEG signals.
- A feature-rich GUI written in wxPython and using the Advanced User-Interface (AUI) module.
Here are some early previews of what CEBL3 can do: