You are here
Visualization
Visualization is an important part of machine learning and pattern analysis. The Electroencephalo-Graphic of The Week (EGOW) project has a simple goal: to produce new and interesting ways of visualizing patterns in EEG and other biosignals. To this end, the CSU BCI Group plans to post a single new graphic every week.
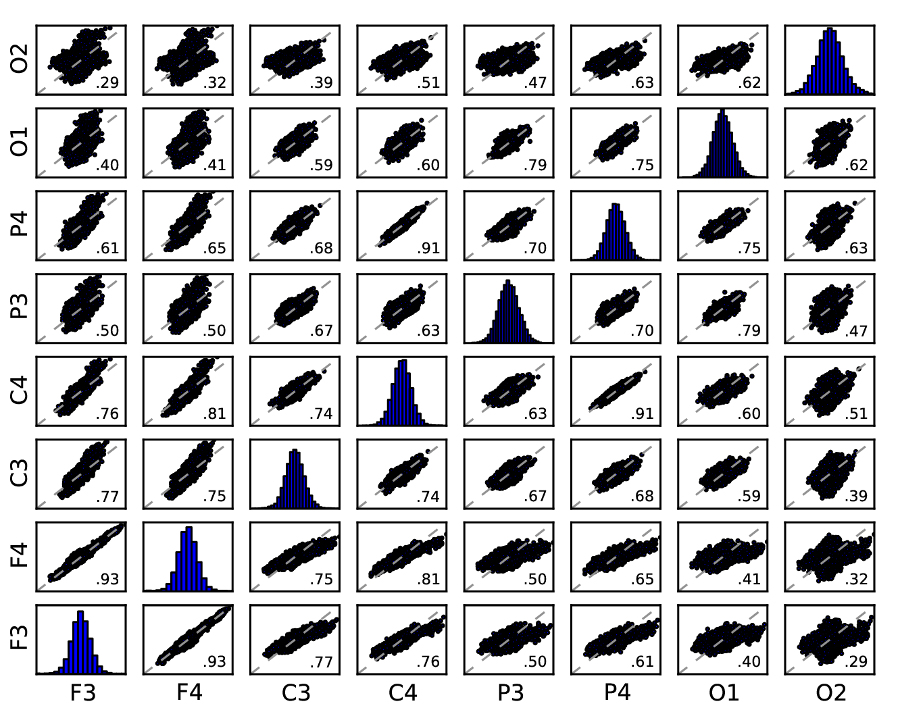
Week 2 - Pairs
This week, we see a "pairs plot" a.k.a. "scatterplot matrix" a.k.a. "matrix of bivariate scatter plots." This shows a scatterplot for each EEG channel plotted against each other channel for a short 8-channel EEG segment recorded using the g.tec g.MOBILab+ with g.GAMMASys electrodes. It also shows a histogram illustrating the distribution of each channel along the diagonal and the person correlation for each channel pair in the lower right corner of each subplot. Notice that channels that are closer together have higher correlation, especially F3 vs F4 and P4 vs C4. Also note that the scale is the same for each subplot. Here is python code to reproduce this image.
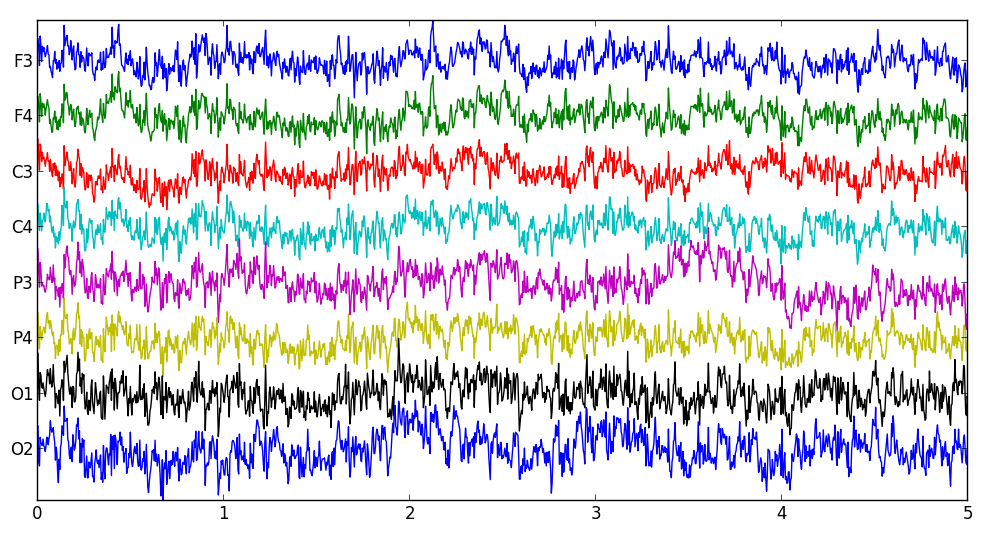
Week 1 - Trace
Let's start with the basics. Below, we see a simple EEG signal trace recorded from our g.tec g.MOBILab+ with g.GAMMASys active electrodes. This simply shows the voltage in microvolts on each channel referenced to the left earlobe over a five second window. Here is python code to reproduce this image.